How to use attendance trends in student ministry
Look at your attendance once a month, not once a week. Compare four-week averages instead of single nights, track first-timers and grades alongside the total, and check any change against your calendar before you react. Then turn what you find into one decision and a short list of students to reach out to. This guide shows how to do that with whatever records you already keep, and where the numbers can mislead you.
The numbers worth tracking
A weekly headcount tells you how full the room was. It doesn't tell you whether students are coming back, or who's drifting. Youth ministry writers keep making this point: Darren Sutton argues you need to count more than bottom-line attendance, and Kara Powell of the Fuller Youth Institute suggests measuring attendance plus other parts of your mission. You don't need a dashboard for this. Five numbers cover most of what attendance can tell you:
| Number | The question it answers |
|---|---|
| Four-week average | Is the group really growing or shrinking? |
| First-timers | Are new students walking in the door? |
| First-timers who came back | Is the group welcoming, or just interesting once? |
| Attendance by grade | Is one age group fading while the total hides it? |
| Leaders present | Is the adult team keeping up with the students? |
Count students and leaders separately. A night with 25 students and 8 leaders is a different night from one with 30 students and 3 leaders, even though the room holds the same number of people.
How to tell a bad week from a real decline
Single nights swing for all kinds of reasons: a home game, a test week, bad weather. Averaging four weeks at a time smooths out most of that. Here's an example from a sample youth group:
| Four weeks | Students each night | Average |
|---|---|---|
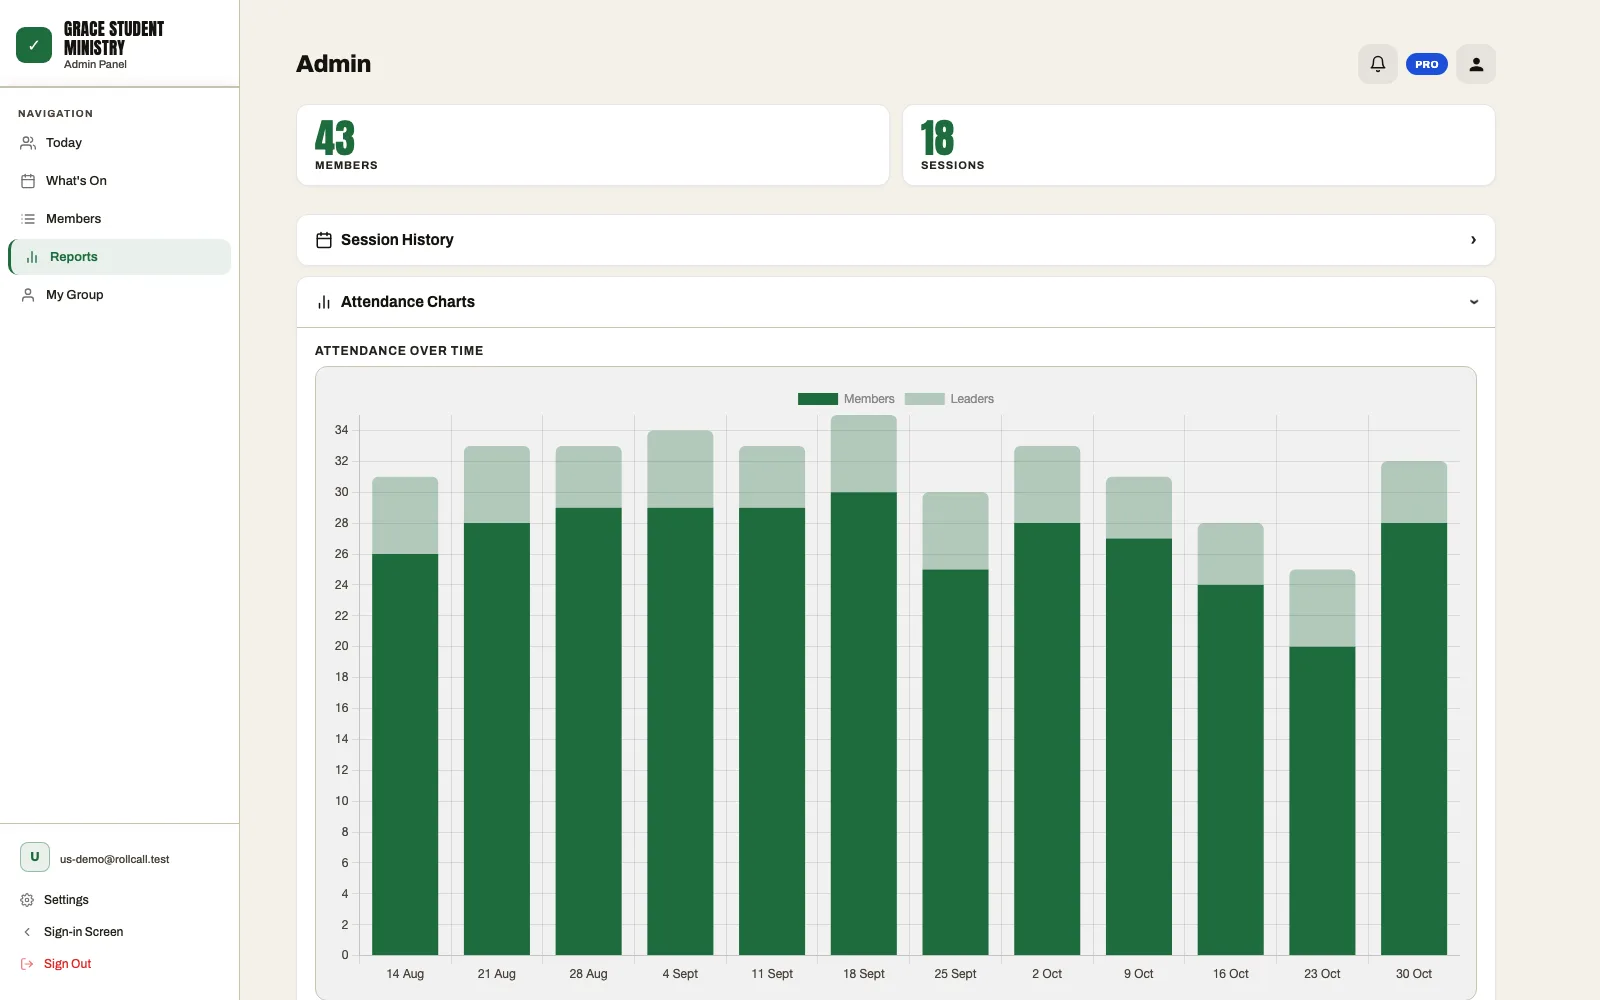
| Aug 14 to Sep 4 | 26, 28, 29, 29 | 28 |
| Sep 11 to Oct 2 | 29, 30, 25, 28 | 28 |
| Oct 9 to Oct 30 | 27, 24, 20, 28 | 25 |
Three things stand out. The 25 on September 25 looked like a bad night, but the average didn't move, so it needed no response. The 20 on October 23 looked alarming, and the 28 a week later looked like a full recovery. Neither night tells the whole story: three of those 28 students were first-timers, so only 25 of the students who'd been coming were there.
That's worth a closer look, not a panic. One lower average can have an ordinary explanation. Two or three in a row, with no calendar reason behind them, is a trend.
Common patterns and what to check first
These are starting points from common youth ministry experience, not diagnoses. You know your students and your town better than any table does.
| What you see | Often related to | Check first |
|---|---|---|
| Big kickoff, lower numbers after | Normal tapering once the newness wears off | Whether the numbers settle above where you were last year |
| A few low nights in a row | Sports seasons, exams, school breaks | The school and sports calendar, and the same weeks last year |
| Slow slide over several months | Students losing touch, or a change in the program or time | Your Missed 2+ list, and what changed when the slide began |
| One grade dropping | A move between middle and high school, a leader leaving, a friend group fading | Who leads that grade, and who those students came with |
| Lots of first-timers, few return | Students invited to events but not connected to anyone | Whether each visitor met a leader and heard from someone that week |
| Leaders present dropping | Volunteer fatigue or schedule changes | Talk to your leaders before you look at the students |
Don't overreact to the first row in particular. Chris Wesley, a student ministry director, writes that some tapering after a kickoff is natural and that teens often just need reminders. It's only a concern if the numbers keep falling once the kickoff effect has passed.
Compare with last year, fairly
Comparing this October with last October removes most seasonal effects, but a youth group isn't the same group from one year to the next. Your oldest students graduated and a new grade moved up. Sutton suggests splitting the comparison so you can see who left through graduation and who aged in. A sensible check has three parts:
- Separate graduates from dropouts. Losing 10 seniors to graduation isn't the same as losing 10 sophomores.
- Follow each grade forward. Compare last year's 9th graders with this year's 10th graders, not 10th grade with 10th grade.
- Line up the calendars. A fall break or tournament that moved by a week can make one month look better or worse than it was.
Your first year of records won't have anything to compare against. Compare four-week averages for now, and write down anything unusual, such as a canceled night or a retreat, so next year's numbers make sense.
A 20-minute monthly review
A trend only helps if someone acts on it. Put a recurring time on the calendar with your key leaders and work through these steps:
- Update the numbers. Note this month's average, first-timers, how many returned, and any grade that's moved.
- Add the context. What was on the calendar this month? What changed in the program, the time or the team?
- Move from numbers to names. Who's behind the change? Which students have stopped coming, and which first-timers haven't returned?
- Assign the follow-up. Give each name to the leader who knows that student best. Our guide to following up with students has a weekly routine and message examples.
- Choose one change at most. Try it for a couple of months before you judge it, because a single night won't tell you whether it worked.
What attendance can't tell you
Attendance shows who was in the room. It doesn't show whether a student has a trusted adult in their life, is growing in faith, or felt welcome. Josh Griffin, a high school pastor, says many churches give weekend attendance too much weight, though he still tracks it and pairs it with small group sign-ups and baptisms. Pick one or two measures that reflect your own goals and keep them next to the attendance figure.
Check the record before you trust the trend, too. The numbers only mean something if attendance gets taken every week. A night when nobody took attendance can look like a night when nobody came, and a volunteer who misses half the room creates a dip that never happened.
Reporting to your pastor or board
Numbers without context invite the wrong conversation. Keep the report short and pair each figure with what it means:
- Show averages, not your best night. Include the same period last year if you have it.
- Explain the change. "Down about three students a night, mostly during football playoffs; here's who we're following up with" is more useful than a bare number.
- Report one thing attendance can't show. That might be small group sign-ups, new leaders or a story a parent shared.
- Leave students' names out. A board needs totals. Individual names and concerns belong with the leaders caring for those students.
Where RollCall fits
You can do all of this on paper or in a spreadsheet. Our free attendance template totals each meeting and flags who's missed two or more weeks in a row. RollCall saves the data entry: students check themselves in, and the history builds as they do.
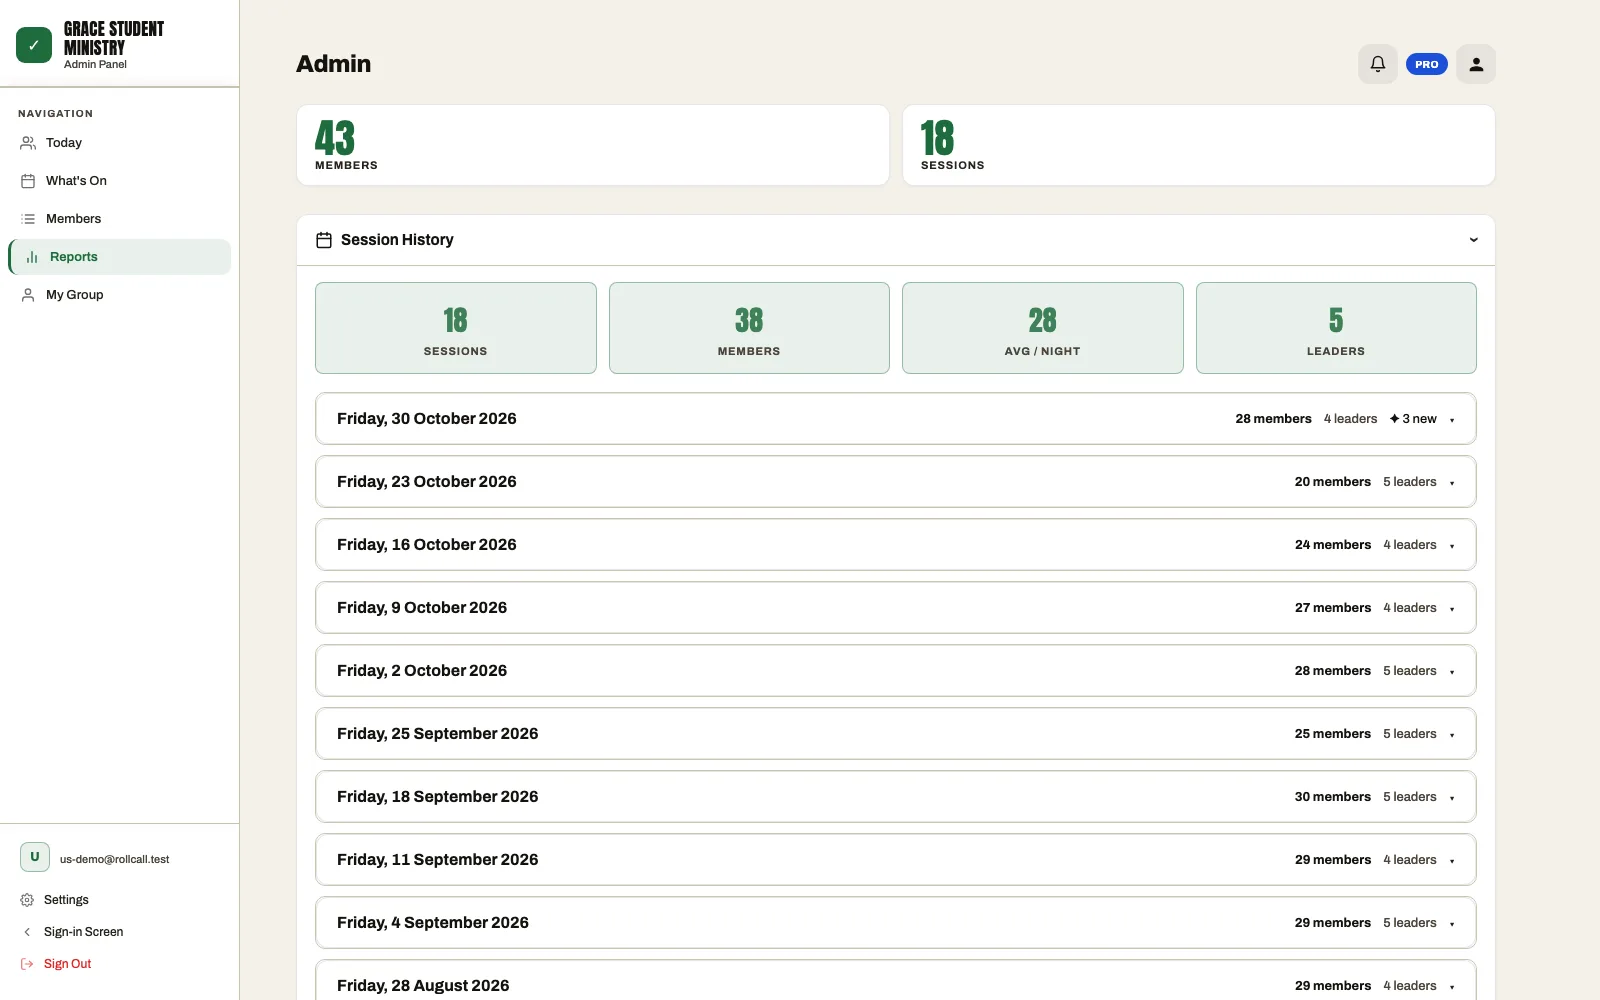
- Every plan: session history showing students, leaders and first-timers for each date, a nightly average, Missed 2+ and Missed 4+ filters, and CSV export.
- Pro: a chart of students and leaders across your last 12 sessions, plus emailed attendance reports.
Some things it doesn't do. RollCall doesn't calculate four-week averages, year-over-year comparisons, attendance by grade over time, or how many first-timers returned. For those, export the attendance CSV, which lists each check-in with its date, name, role and grade, and work them out in a spreadsheet. The app's average covers the last 12 months and skips nights with fewer than five students. It also records one check-in per person per day, so two meetings on the same day count as one attendance. And it measures who came, not how they're doing.
Common questions
What's a good attendance number for a youth group?
There's no universal number. It depends on your church's size, your community and how long the group has been running. Your own trend over time, and whether new students come back, tell you more than comparing with another church.
How often should we review attendance trends?
Monthly works well for trends, because a single week says very little. Check separately each week for individual students who've missed two meetings in a row, since that needs a quicker response.
Why did our youth group attendance drop after our kickoff?
Some tapering after a big kickoff is normal, because the first night brings in students who won't come every week. Compare the average once things settle with the same weeks last year, and be concerned if it keeps falling.
Should we compare our numbers with last year?
Yes, once you have a year of records, because it removes most seasonal effects. Account for graduates and the new grade that moved up, and follow each grade forward rather than comparing 10th grade with 10th grade.
Can RollCall show attendance trends?
Partly. Every plan includes session history with a nightly average, and Pro adds a chart of the last 12 sessions. RollCall doesn't calculate four-week averages, year-over-year comparisons or attendance by grade over time, but you can export the attendance CSV and work those out in a spreadsheet.
How much does RollCall cost?
RollCall is free for groups of up to 30 people, with no card needed and no time limit. Larger groups use Pro at US$9.99/month (a launch price; standard $19.99), which includes 150 people and starts with a 14-day free trial.
Want to see how this could work for your group? You can try RollCall free. It's free for groups of up to 30 members, with no card needed. Or see how RollCall works for churches.